Tag Archives: Twitter

Identifying relevant tweeters: keywords and stemming

tweeters

I’ve previously described why an organisation would want to analyse Twitter and described my initial architecture for achieving a targeted analysis. The targeting relies on identifying tweeters who are relevant to the organisation’s aims in order to keep the size of the network manageable and remove the ‘noise’ of irrelevant tweeters. To date identifying ‘relevant’ tweeters has relied on scoring each tweet against a list of keywords; this is somewhat crude and I’ve been looking at simple ways to improve it. I’ve been aware of stemming for a while and have have now found a C# implementation, along with some others. There is a good explanation of stemming on Wikipedia so I won’t try and repeat that. To apply it first run all the keywords through the stemming algorithm and then run all the words in the tweet through the algorithm before comparing. This should produce more matches, or eliminates  the need to try and capture all the variations (plurals, tenses, etc.) of the word you are interested in.  It’s definitely not perfect and I am aware there are more sophisticated approaches which take context into account, however think it will be better than just keywords. I’ve not tried comparing results against a simple keyword list, before I do does anyone have any further guidance?


Mapping the Graph of Retweets

In the pre-print book Twitter Data Analytics section 5.1.1.1 ‘Retweet Network Fallacy’ describes the problem that with a retweet you can only tell who the original tweeter is and not the network through which it propagated.

I’ve been doing some work on using retweets to help understand the strength of connections in a social network, you can see some early results here and this is an issue. I believe this can, at least partially, be resolved by using follower data.

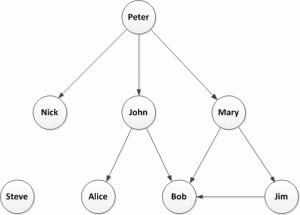
I’ve previously discussed Twitter Followers and I don’t think this concept takes too much explanation. Here is a simple example of a followers network: Peter is followed by John who is, in turn, followed by Alice and Bob, etc.
retweets_1

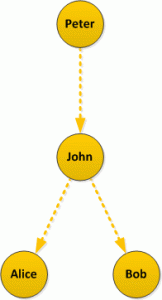
Now let’s look at the problem described in Twitter Data Analytics, retweets: in this simple example Peter is retweeted by John who is, in turn retweeted by Alice and Bob
retweets_2

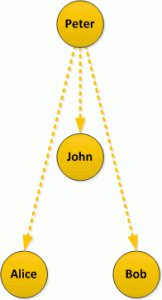
But if you look purely at retweet data returned by the Twitter API you will see this:
retweets_3

It appears that John, Alice and Bob retweeted Peter; the structure of the network is lost.

Let’s look at this again with the retweets overlaid on the followers network:
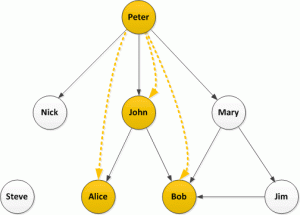
retweets_4

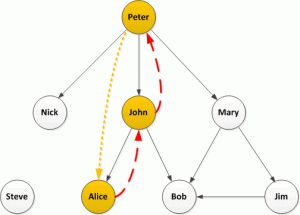
How does this help? Well firstly load the follower network into a graph database and then take a look at each retweeter. Graph databases are excellent at searching relationships and finding paths, so starting with John and Alice:
retweets_5

In this simple case there is a single path from John back to Peter with no intermediate nodes, it’s quite likely John directly retweeted  Peter. The only path from Alice back to Peter is the one through John (and we know John retweeted) so it is quite likely that Alice saw the retweet from John and retweeted that.

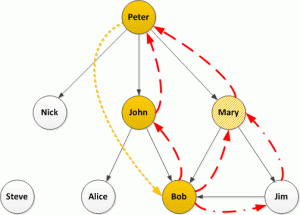
Now humans, being complicated things, make complicated social networks. Let’s take a closer look at Bob:
retweets_6

There are multiple paths from Bob back to Peter and we could take the following strategies: look at only the shortest paths, look at all paths, or set a limit on path lengths (if we set a limit of 2, also the shortest, we will only identify the paths through John and Mary but not Jim). I would suggest, if possible, looking at all paths but this will have performance consequences for very large graphs.

The next question is do we want to look at all the tweets from Mary and Jim to see if they also retweeted the original (this can be an expensive operation – in API time or if buying tweets)? If not then we don’t know the actual path but can estimate the likelihood of each path having been taken perhaps with the shortest being more likely (I’m not exactly sure how the maths has to work here…help me out), or maybe there is some historical data we have about existing paths.

If examining each person’s tweets then consider the following possibilities, from the above example:

  1. Only John retweeted: the path is most likely via John
  2. John and Mary retweeted: it’s equally likely to have come via John or Mary, unless there is some historic data suggesting stronger existing ties to one of them
  3. John, Mary and Jim retweeted: well I’m not sure, are the shorter paths more likely, I guess they are as they would have placed the retweet on the users timeline first but the path through Jim cannot be completely dismissed, I’m wondering if infer.net could help here?

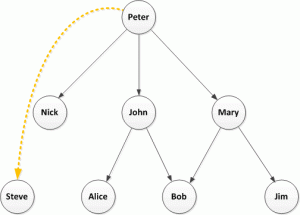
Finally consider this:
retweets_7

Well who knows? Maybe there are some protected Twitter accounts or maybe Steve picked this up because of a hashtag, which is a whole other topic.

Has anyone out there already answered these questions, please get in touch?
 

Circular Layouts, Binning and Edge Bundling

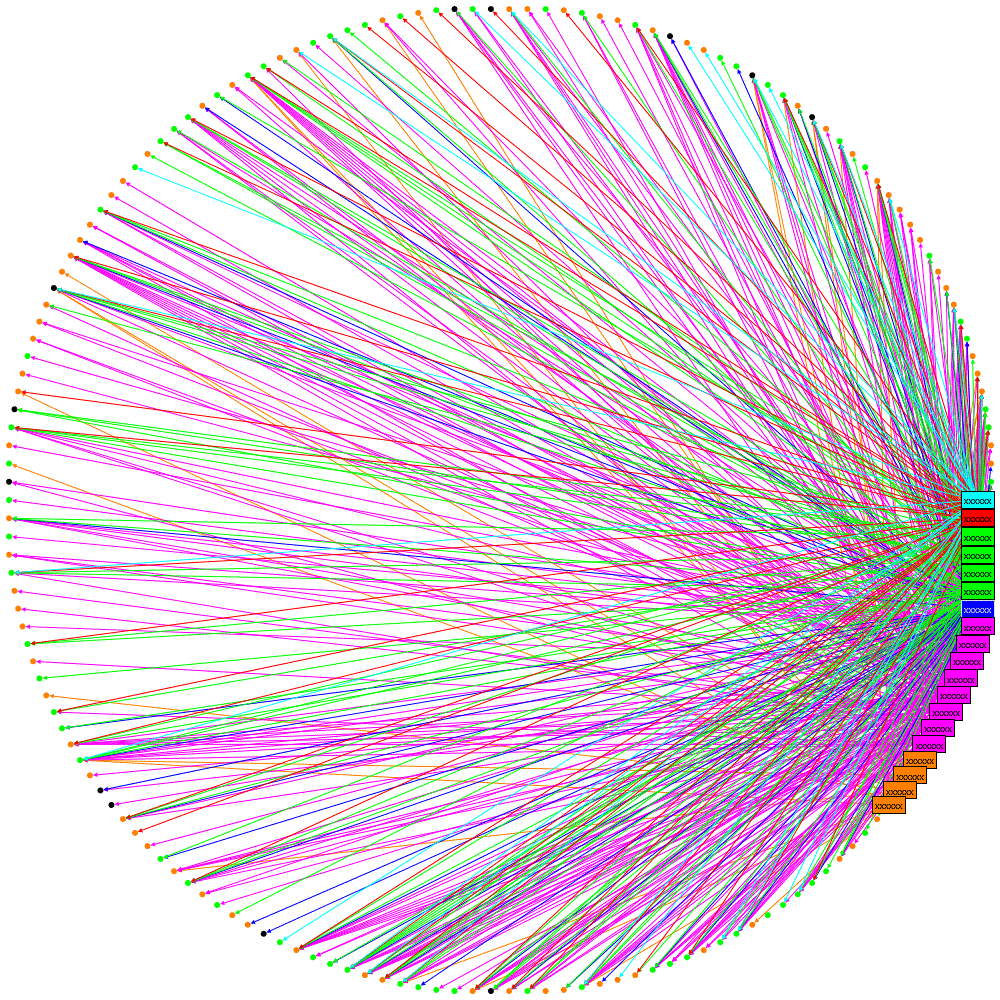
Circular layouts can be very useful and NodeXL does a great job of rapidly exploring social network graphs. However I needed to generate graphs programmatically so turned to the NodeXL libraries. I picked the circular layout but was disappointed with what it produced:

circular plain

Let me explain what this diagram is attempting to show: the rectangular labels are the organisation’s tweeters, the colours represent a sub-division of the organisation they work for. Unlabelled nodes (circles) are the followers. Followers are coloured green or orange based on which information the organisations would like them to receive and this colouring is the same for two specialist sub-divisions. Where an orange line is seen going to a green follower, or vice-versa, then it can be implied that the follower is not receiving the desired information.

This layout is not great: the order of nodes is just as they were added to the graph: all the organisations’ tweeters were added first so cluster together and there is no logic to the order the remaining nodes (followers) are added.

The first improvement that can be made is to use binning. See  http://www.smrfoundation.org/2010/01/14/component-binning-a-network-layout-improvement-in-nodexl-v-108/

To apply Binning with the NodeXL library simply set the UseBinning property:

oCircleLayout.LayoutStyle = LayoutStyle.UseBinning;

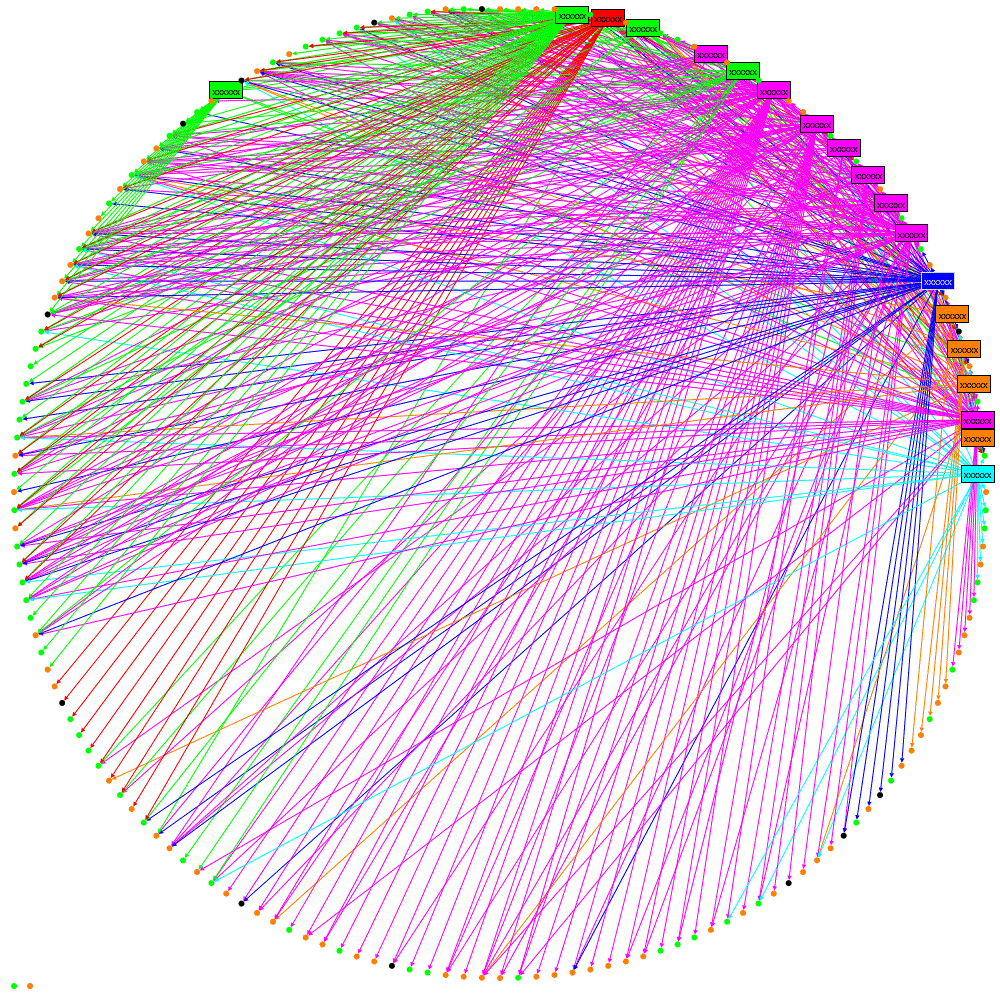
The layout now looks like this:

circular binning

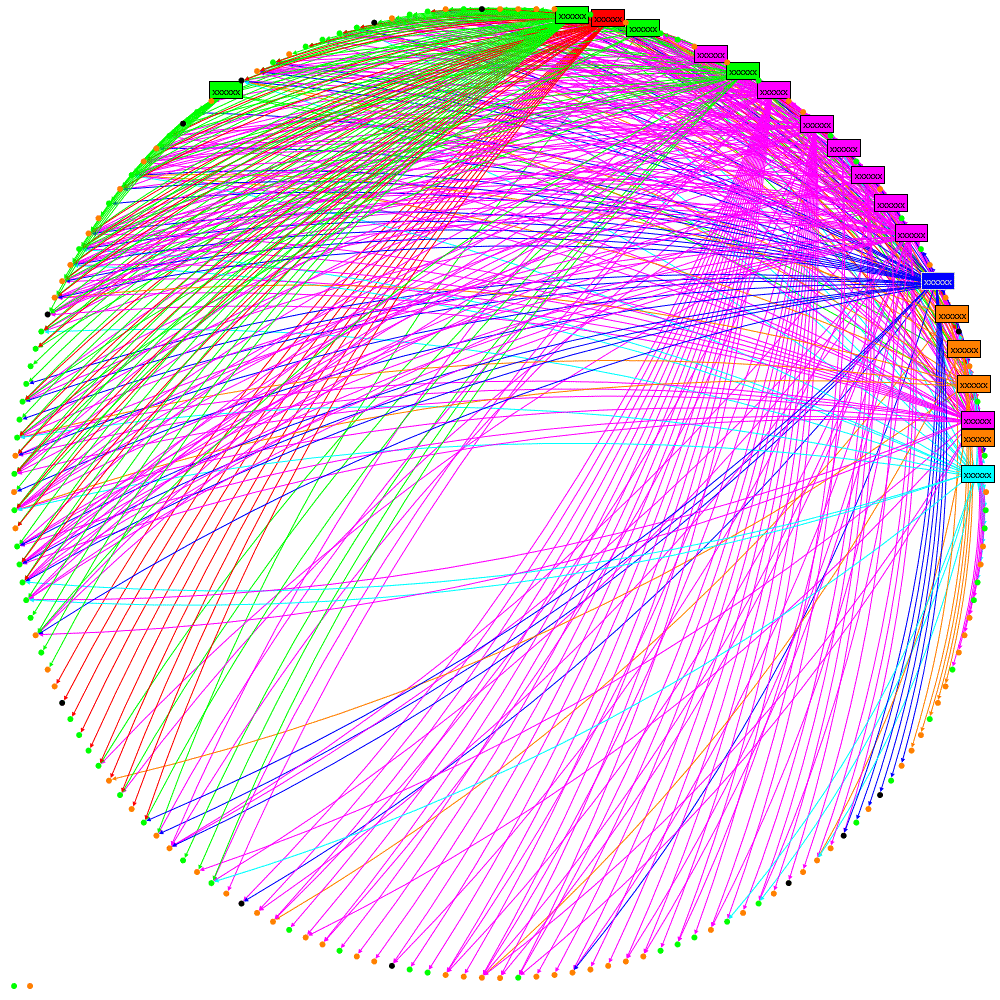
We can see now that there is a cluster of followers who follow multiple tweeters from the organisation (clustered towards the top). However it is still quite confusing where a lot of lines cross-over. Maybe curved lines would be better….

oNodeXLVisual.GraphDrawer.EdgeDrawer.CurveStyle = EdgeCurveStyle.Bezier;

circular bezier

Not really an improvement. The answer is Edge Bundling, see these links for better explanations than I can provide:

http://www.cg.tuwien.ac.at/courses/InfoVis/HallOfFame/2007/Alsallakh/

http://www.win.tue.nl/~dholten/papers/bundles_infovis.pdf

http://www.infosthetics.com/archives/2009/06/force_directed_edge_bundling_for_graph_visualization.html

this is how to add it from the NodeXL libraries:

EdgeBundler ebl = new EdgeBundler();

ebl.UseThreading = false; // when running in Azure or it hangs

ebl.BundleAllEdges(oGraph, new Rectangle(0, 0, GraphWidth, GraphHeight));

oNodeXLVisual.GraphDrawer.EdgeDrawer.CurveStyle = EdgeCurveStyle.CurveThroughIntermediatePoints; 

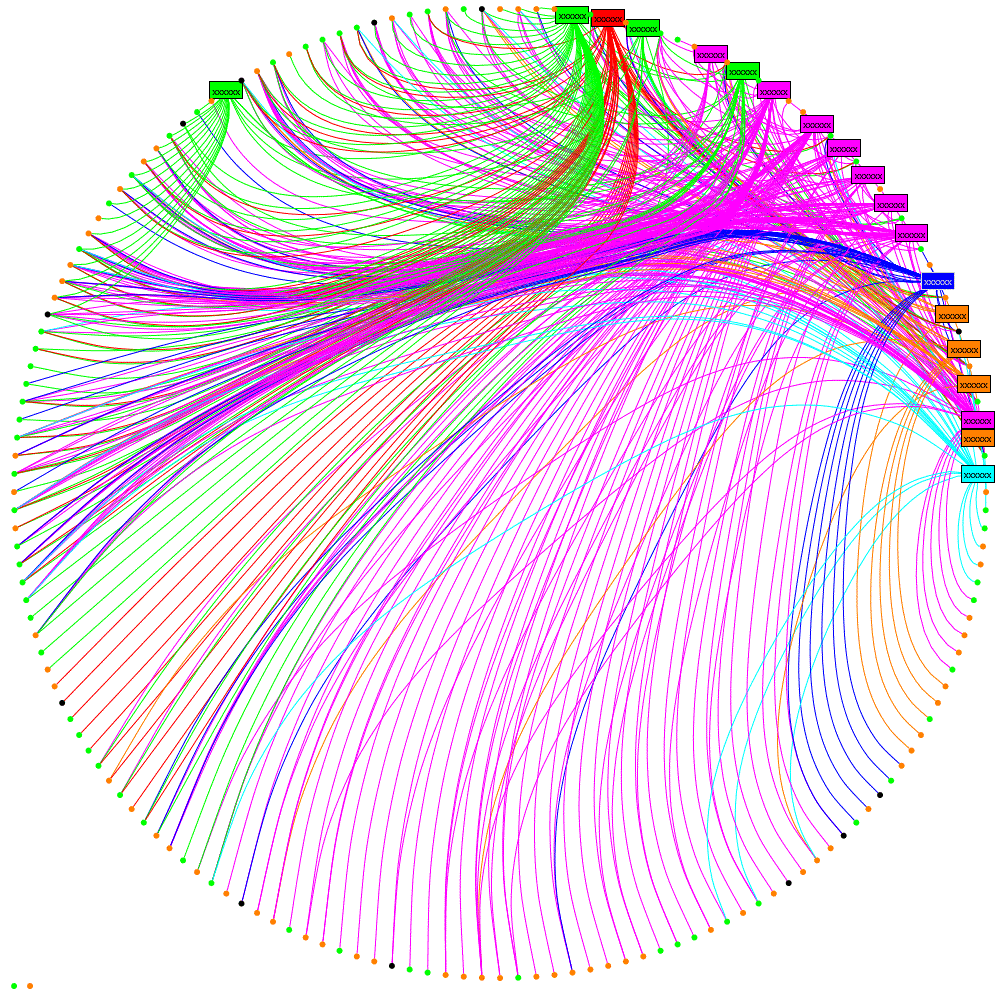
and the result:

circular bundling

which I hope you’ll agree helps reveal some real structure about the tweeters and
their followers.

Update 15/07/2013

I’ve created a test page if you want to try out these features of NodeXL here or get NodeXL

Visualisation for Twitter Followers

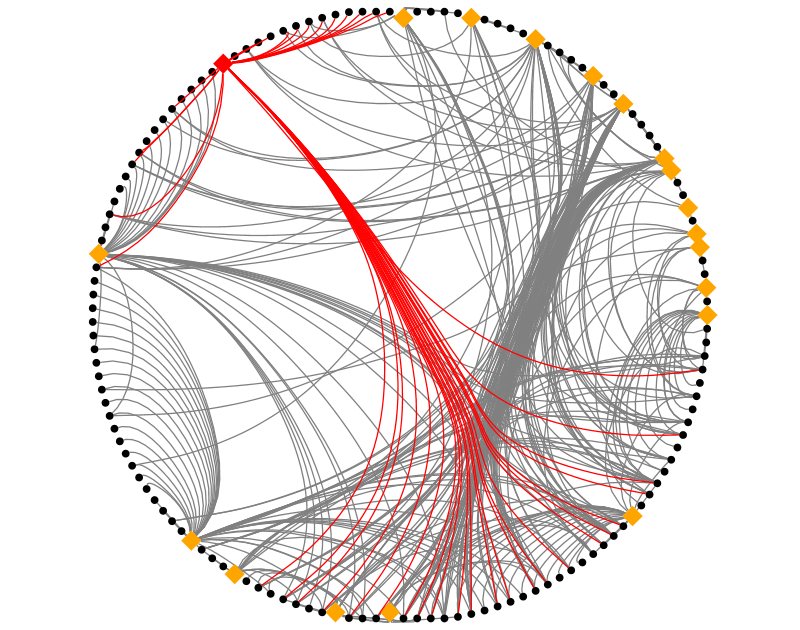
An organisation wanting to get its message out through social platforms needs to understand the relationships between the organisations tweeters and their followers. For example how much overlap is there or how many target twitter followers would be totally lost if one of the organisations tweeters was lost. Whilst it’s easy to obtain the basic information about followers and analyse this in tabular format it would be nice if there was a visualisation that convey this information in a more digestible format. Step forward the circular layout:

TweeterEdgeBundleNoLabels

This visualisation was created with NodeXL using the circular layout and bundled edges. The orange diamonds are the organisations’ tweeters and the black circles are followers. One tweeter has been selected and their followers highlighted, in red. The following observations can be made:

  • There are a number of followers who only follow one of the organisations’ tweeters (look at 7 – 12 o’clock)
  • The thickest bundle of connections identifies a number of the organisations’ tweeters with a significant overlap of followers (look at 2 o’clock and  5  – 6 o’clock)
  • The tweeter highlighted in red has a mix of unique and shared followers.

These observations can be used by the organisation to consider how best to get its message to target followers.

Mining Twitter from Windows Azure (Part 1)

Organisations need to know what is being said about them, and Twitter is one of the obvious places to find this out. I’m not looking at trawling all of Twitter but targeting tweets about the organisation or its competitors and what the organisation and its competitors are tweeting.

Because Twitter data is mostly already public, and no private data is being retrieved, this investigation was also a good opportunity to explore Microsoft’s Azure cloud computing platform.

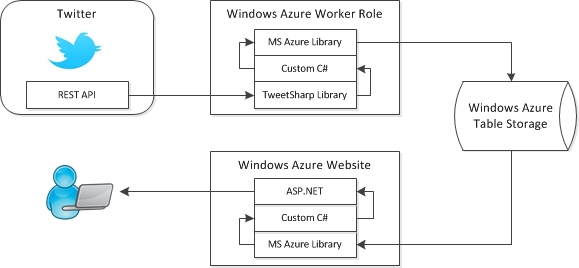
I have built the architecture shown in the following diagram in order to collect and analyse Twitter data:

Twitter Monitor

Nothing here is not well documented elsewhere but I’ll run through the key components:

Having built the above I can say it all works very well, my key learning point are:

  • The Twitter API provides a search which is a great place to start exploring who is saying what about an organisations
  • Thinking in terms of relational database tables is probably a mistake (that I have fallen into). For example I have a table of followers for a given Twitter account and then a table of information about Twitter accounts; to get the information for all the followers of a given Twitter account it is necessary to join these table. Doh! Can’t do that with Azure Table Storage. Now because I’m not dealing with large volumes this can be accomplished by ‘joining’ the tables in memory (I used a hash table but I’m sure LINQ can do it). The correct solution is either to use SQL Azure or move the information about the Twitter accounts into the table of followers and accept some duplication…or maybe a graph database 🙂
  • Probably this is a bug: TweetSharp (or the underlying JSON and REST libraries) will cause a stack overflow (!) if trying to retrieve a list of follower IDs when the Twitter user has protected tweets;  you can ensure this does not happen by checking the user’s protected status first.