Making Innovation Happen in a Regulated Firm

Technologists, like me, enjoy the challenge of making something new out of some old and ignored data they found lying around. However in a regulated industry how do you actually get that into the hands people who can derive a real business benefit? Below is my own take on the innovation process. I’d like to really stress the fist step – at some point you are likely to want to do something new with data and unless you have data protection, compliance and the right business people on-board it will be a struggle. I hope it goes without saying this is a process that needs to run continuously and repeats, with different activities at varying stages of maturity through the process.

Innovation Flowchart


Throughout the innovation process there are a number of contributors to success that always need to be considered and addressed:

Senior leadership buy-in: senior leadership need to make their support of innovation known and encourage firm-wide participation.

Funding: allocate a portion of IT and business budgets for R&D and the production of innovation proposals.

Competing initiatives: access to firm-wide and local forum which may be independently adopting innovative technologies

Finding opportunities and choosing aligned activities: adequate time and attention from mid-senior level managers and leaders.

Sourcing ideas: mechanisms to promote innovation and gather ideas from the practitioners. E.g. internal social media, newsletters.

Visibility: having somewhere people can go to see ideas, our latest thoughts on technology and active initiatives.

Recognising the contribution of staff: staff managers must be appraised of the importance the firm places on innovation.

Global business and cultural differences: opportunities for networking across the firm to build relationships and understand other groups’ perspectives.

Data protection and other regulations: data protection and compliance teams should have/create a process for the use of real data in PoC scenarios.

No ivory tower: employees tasked with driving and innovation should be integrated in broader teams and support ‘BAU’ work

Promoting innovation by celebrating success: internal and external comms teams can help write, edit and distribute stories and case studies.

Data Quality: a continuous programme to asses and improve data quality.

Data-driven CVs

Having recently been seeking a new position I’ve noticed that very often people can struggle to pull basic facts from my CV, for example “I see you did x for n years”. I can understand why, they have a lot to look at and only limited time to wade through the detail describing a long, and varied, career. Now I’m not the first to suggest a data-driven, or infographic, C.V. but has anyone got experience of using one applying for software architect roles, and how well was it received?

About Me Visual

Ageing SNA Data

fadingSNA

It’s been a while since I was collecting data for some organisational SNA but I recently had cause to look back at this work which describes assigning weights to each data source. Many people have since left the organisation studied which is, in itself, easy to know about from org charts or HR records but what about people who in the past shared a lot of email or IM but no longer do? Should recent data be given more weight than historic data? I’ve searched for some guidance but not found any, does anyone in this forum have any advice?

SNA Quick Win: Outsourcing Organisational Design

When entering outsourcing arrangements many organisations like to bring in the role of “Relationship Manger” which is supposed to act as the interface, or at least an initial broker, between the two organisations. Each party tends to have these roles and the amount of informal communication that does not travel via these roles varies depending on the levels of trust and formality. The question is how many people should be in these roles and between which groups in the two organisations should they be placed?

Looking at the original organisation, prior to outsourcing, some simple SNA tools can help: by measuring the communication between the two groups (retained and outsource target) it can be seen who the key people are bridging the groups and the volume of that communication. Using a tool, like Gephi, and running a layout such as Fruchterman-Reingold this can be visualised as shown below:

borderGR

Note in the centre there are some individuals with strong ties between the two groups, this would be a prime place to consider placing relationship managers. There are also another couple of interesting observations: (1) there are a lot of less strong relationships between individual in the two groups which, taken individually, might not seem significant but when added up are significant and must be considered; (2) some individuals appear to be in the wrong group (e.g. the red dots amongst the green dots) and their allocation to the ‘retained’ or ‘outsource’ group should be reconsidered.

Unstructured data: text

tamingtext

I recently completed an excellent book which examines how to deal with information presented as text. It’s called Taming Text from Manning. The authors do a good job of introducing each topic and explain how a number of open source tools can be applied to the problems each topic presents. I’ve not studied the latter but the former are a great introduction.

I have summarised each topic, below:

  1. It’s hard to get an algorithm to understand text in the way humans can. Language is complex and an area of much academic study. Text is everywhere and contains plenty of potentially useful information.
  2. The first step in dealing with text is to break it down into parts and the most simplistic aim of this step is to extract individual words, however there are a number of approaches and more sophisticated ones will need to handle punctuation. The process of splitting text down is called tokenisation. Individual works may often then be put through a stemming algorithm in order to be able to equate pluralised and different tenses of the same stem. A stem might be a recognisable word but not necessarily.
  3. In order to search content it must first be indexed which will require tokenisation and stemming and maybe also stop-word removal and synonym expansion. It is also useful, for subsequent ranking, to use an index that allows the distance between words found from the search phrase to be calculated for each document searched. There are a number of algorithmic approaches for ranking results the simplest of which are based on the vector space model. Obviously ranking is an evolving area and the big internet search engines are constantly evolving it. Another refinement that can be applied to search is the key constituent of spell-checking: fuzzy matching.
  4. Fuzzy matching is another area of academic research with some established algorithms based on character overlap, edit distance and n-gram edit distance which may all be combined with prefix matching using a trie (prefix tree). The most important aspect of fuzzy matching to understand is that different algorithms will be more or less effective depending on the sort of information being matched, for example Movie Titles are best matched on Jaro-Winkler distance but Movie Actors are bet matched with a more exact algorithm given that they are used like brand names.
  5. It can be useful to be able to extract people, places and things (including monetary amounts, dates, etc.). Again there are a number of algorithms for achieving this including open source implementations from the OpenNLP  project. Machine learning can play a part provided there is plenty of tagged (training) examples available, which is especially useful where domain-specific text needs to be ‘understood’.
  6. Given a large set of documents often there is a requirement to group similar documents. This is a process called clustering and can be observed in operation on news amalgamation sites. Note that clustering does not assign meaning to each cluster. There are a number of established algorithms, many of which are shared with other clustering problems. Given the large volumes and algorithm complexity a real-world clustering task is quite likely to want to make use of parallel processing and this is what the Carrot and Apache Mahout projects provide by building on top of Apache Hadoop.
  7. Another activity for sets of documents is classification which is similar to clustering but starts with sets of documents that have been assigned to a pre-determined category by a human or other mechanism, for example asking users to tag articles. Example classification tasks are sentiment analysis or rating reviews as positive or negative. Of course there are a number of algorithms and implementations to choose from with each having trade-offs in accuracy and performance.

Organisational Network Analysis: Actionable Insight during Restructuring

I have previously described how influence can be measured from data organisations regularly collect. Take a look again at two people: A and B (B reports to A):

influence

You can see how B is starting to diverge from A and loose influence, so what is the underlying cause? The organisation has been undergoing restructuring and reducing headcount which has impacted A and B to different extents. Look at the graphs of their strongest ties, in the diagrams below, the blue nodes are current employees and the red nodes are employees who have, at this point in time, departed the organisation:

A:

graphA

B:

graphB

Notice how there are more red nodes central to B’s social network when compared to A’s. B may be feeling disconnected form the organisation because so many people they knew well have left but A is just not feeling this to the same extent so might not understand why B is exhibiting reduced levels of engagement with the organisation. I hope you can see that organisational network analysis can provide a way to quickly measure the impact to individuals, when re-organising, in order that action can be taken to support them whilst they rebuild their social networks.


Word Clouds of Organisational Communication: Poor Man’s Sentiment Analysis?

wordmap

This is just an idea I have not yet had the chance to implement so, sadly, cannot share any results.

The idea is this: if we collect all the contents from communications in an organisation, say from instant messaging, and present the results in a word cloud does this provide a useful insight? I’m aware that for more sophisticated sentiment analysis context is very important but inside an organisation the context is more-or-less fixed, both from the perspective of those writing the communications and those observing the resulting word cloud. Could it work, does anyone have any experience of try this or similar analysis?


Options for Structuring Graph Databases

I’d like to start by explaining why I referred to “NOSQL” rather than “NoSQL”: I believe that “Not Only SQL” is more accurate than “No SQL” because, of course, we can make use of both relational databases and the alternatives like document and graph. In fact this is probably just about the most miss-leading terminology of recent years because, as you will see from this article, Graph databases are structured and have query languages so they are in those regards no different to relational databases. Rant over, let me describe what I’ve learnt and hope it of help to your own journey beyond relational databases.

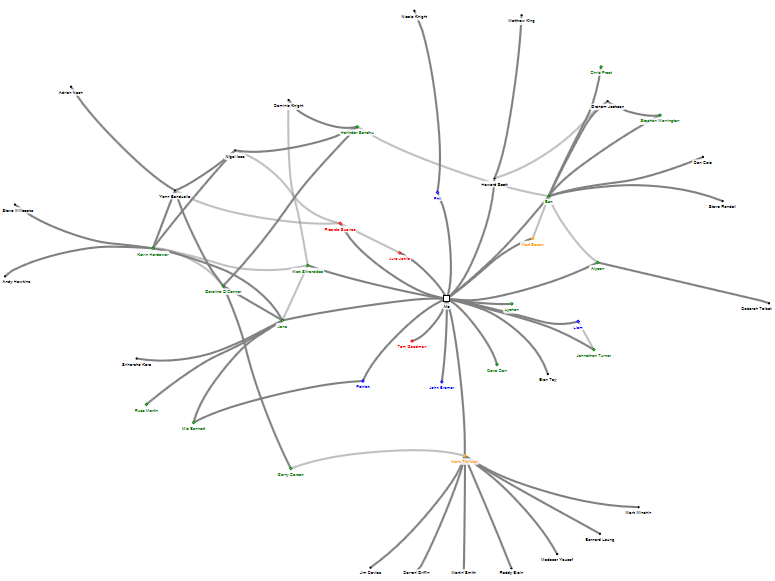
The reason I started working with a Graph database was to help my research into Social/Organisational Network Analysis. To get beyond the basics and start to really understand influence, and how it changes over time, I needed to be able to query the composition and strength of multiple individuals’ networks, enter the Graph Database. I won’t try explaining the concepts of a Graph Database as Wikipedia does an excellent job so I’ll jump straight in assuming you read the Wikipedia article. I chose to use Neo4j because there is some support for .NET via a couple of APIs. For the purposes of this discussion the key constructs in Neo4j are: nodes (vertices), relationships (edges) and attributes; both nodes and edges can have attributes.

The data entities I have been dealing with are: employees and items of electronic communication such as email and IM as well as other pieces of information that help identify the strength of social ties such as corporate directories, project time records and meeting room bookings. There is a whole spectrum of how these can be represented in a Graph Database but I will look at three scenarios I have either implemented, seen implemented or considered.

1)      Everything is a node

graph database 1

All the entities you might have previously placed in a relational database become a node, complete with all the attributes such as “meeting duration”. There are relationships between the nodes which have a type and may also have additional attributes.

Advantages: all the data in one place; you have the flexibility to query the graph in as much detail as the captured attributes allow.

Disadvantages: you could end up with a lot of nodes and relationships, the 2000 person organisation I studied produced well over a million emails per month so by the time you add in IMs and other data over a couple of years you will be in the 100 million plus range for nodes and even more for relationships potentially giving you an actual [big data] problem as opposed to the usual big [data problem]; the queries could be very complex to construct, perhaps not an issue once you have some experience but it might be better to start with something simpler.

2)      Most things are a relationship

graph database 2

Here we keep only the ‘real world’ entities, the people, as nodes and push all the other information into relationships. For my study this would massively reduce the number of nodes but not relationships. In fact for some information, like attendance of a given meeting, the number of edges dramatically increases from n (where n is the number of people in the meeting) to n(n − 1)/2 (a complete graph).

Advantages: a lot fewer nodes (depending on the characteristics of the information involved)

Disadvantages: more edges (depending on the characteristics of the information involved); duplication of attribute information (e.g. meeting duration) in relationships; might make some queries harder or not possible.

3) Hybrid Relational-Graph

graph database 3

This approach effectively uses the Graph Database as a smart index to the relational data. It was ideal for my Social Network Analysis because I only needed to know the strength of relationship between the people(nodes) so was able to leverage the power of the relational database to generate these using the usual ‘group by’ clauses. I’ve shown an ETL from the Relational data to the Graph data because that’s the flow I used but they could be bi-directional or built in parallel.

Advantages: much smaller graph (depending on the characteristics of the information involved), in my data sets I’ve found 1,000 employees mean around 100,000 relationships; much simpler graph queries.

Disadvantages: Data in two places, which needs to be joined and risks synchronisation problems.

As you can guess I like the third option, mostly because it’s a gentler introduction in terms of simplicity and scale, you are less likely to write queries which attempt to return millions of paths!

At the beginning (in the rant section) I mentioned Neo4j has a query language (actually it has two). Rather than repeat myself take a look at a previous post where I describe some Cypher queries.


Unusual Sources of Organisational Network Analysis Data

cctv-camera

In the organisation I’ve studied email is the undisputed winner at exposing the organisational network. I’ve previously described a number of other sources of data for organisational network analysis but are there others?

Some of the more obvious ones are telephone records, both desk and mobile phones. These would be relatively simple to analyse, provided they are easily matched to employees, and I expect the results would be quite good.

But there are some others I’ve noticed:

  • Conference call dialled-in numbers: captures employees joining meetings by phone, there would be some overlap with meeting room bookings but as these are going to be at the same time de-duplication is possible.


  • Entry control systems: people arriving or leaving a particular building or floor at the same time are likely to have shared some conversation.


  • Train, Air and Hotel bookings: employees making the same trips are fairly likely to be spending time together discussing both business and other interests and maybe even having a drink in the hotel bar!


  • Electronic payments for vending machines and catering: employees who have used a particular electronic payment point at the same time might have had a discussion over a coffee.


  • Car pools: if the organisation manages a car pool scheme it is fairly certain those sharing a car will get to know each other.

I’ve not had the opportunity to explore any of these data sets so I’d like to hear from anyone who has. But is this going too far, your thoughts?

Identifying relevant tweeters: keywords and stemming

tweeters

I’ve previously described why an organisation would want to analyse Twitter and described my initial architecture for achieving a targeted analysis. The targeting relies on identifying tweeters who are relevant to the organisation’s aims in order to keep the size of the network manageable and remove the ‘noise’ of irrelevant tweeters. To date identifying ‘relevant’ tweeters has relied on scoring each tweet against a list of keywords; this is somewhat crude and I’ve been looking at simple ways to improve it. I’ve been aware of stemming for a while and have have now found a C# implementation, along with some others. There is a good explanation of stemming on Wikipedia so I won’t try and repeat that. To apply it first run all the keywords through the stemming algorithm and then run all the words in the tweet through the algorithm before comparing. This should produce more matches, or eliminates  the need to try and capture all the variations (plurals, tenses, etc.) of the word you are interested in.  It’s definitely not perfect and I am aware there are more sophisticated approaches which take context into account, however think it will be better than just keywords. I’ve not tried comparing results against a simple keyword list, before I do does anyone have any further guidance?