1.66 has been a remarkably constant result for the average number of recipients to which each email is sent. Looking more closely one recipient is by far the most common:
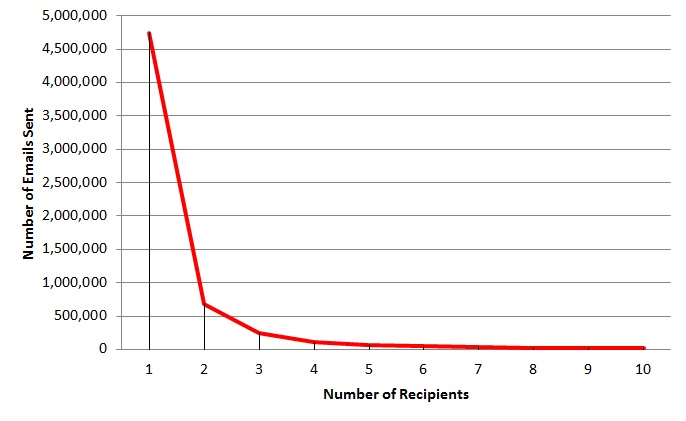
(chart truncated at 10 recipients)
1.66 has been a remarkably constant result for the average number of recipients to which each email is sent. Looking more closely one recipient is by far the most common:
(chart truncated at 10 recipients)
After 6 months of colleting email data it should be possible to spot trends and variations. Some variations, mostly around holiday periods are quite obvious but trends have not been so obvious. One measure in particular has been remarkably constant: the average number of recipients per email. The following plot shows this average over the last 27 weeks for approximately 2,000 people and 10,000,000 emails:
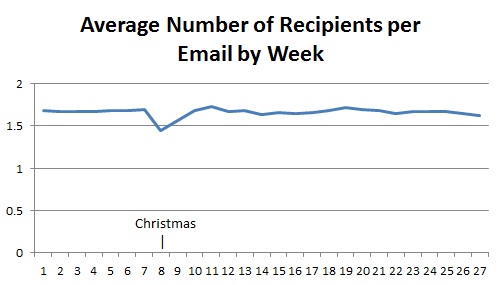
The average across the entire period is 1.66. The only noticeable variation occurs during the Christmas holiday when the organisation is almost completely closed.
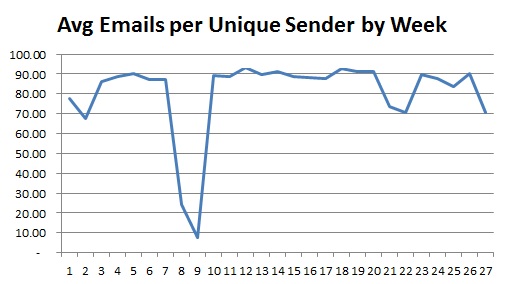
Compare this with a couple of other averages:
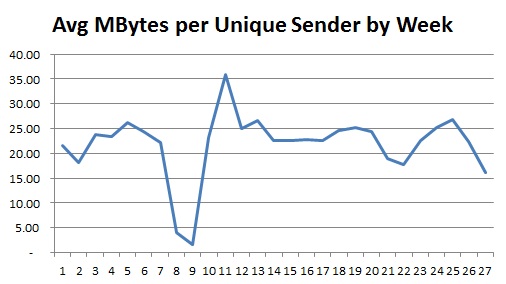
That last one, which effectively shows the average size of emails, is interesting in that there is a peak immediately following the end of the Christmas holiday; this could be interpreted as a build-up of information suddenly being released or it could be because there is a lot of ‘set-up’ information sent around at the beginning of the year.
The previous discussion of Dunbar’s number suggests larger meetings will be less effective. Is there any data to support this? The following chart shows emails sent during meetings:
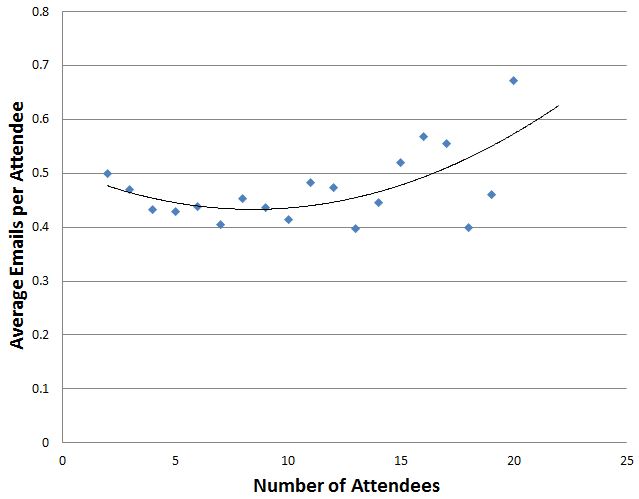
Seems to suggest the larger the meeting the less attention people are paying but not a particularly remarkable result. I expect looking at instant message traffic during meetings would be more revealing.
The next data source you may have in your organisation also comes from Microsoft Exchange Server. If you use Exchange Server to book meeting rooms then this can be mined. As always what can be accessed will depend on your organisations privacy policies. In the organisation I describe here I have access to the calendars for well over half of the meeting rooms using my standard authentication credentials because I am allowed to book meetings in these rooms. Through the room calendar I can also see when other people have booked meetings; it’s not possible to see the meeting subject but it is possible to see a list of attendees. Unlike email I have accessed the meeting room calendars through the Exchange Server API; this is described by a number of others so I won’t reproduce it here, search for ‘Microsoft.Exchange.WebServices’ and ‘GetRoomLists’.
Meetings differ from email in that they are a many-to-many event rather than on-to-many. There will be a meeting organiser but this is often a PA so I do not give any special meaning to them. Just as with email I prefer to load data into a relational database first, the table structure is shown, below.
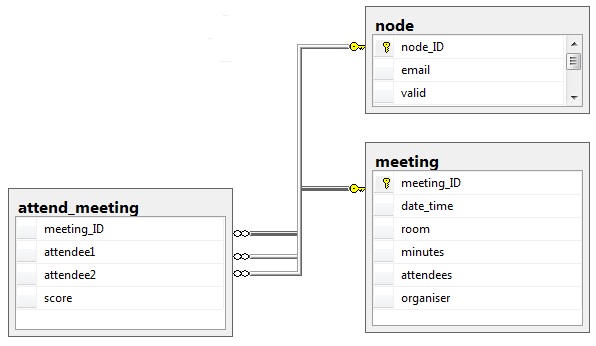
You’ll notice that the table attend_meeting has a field ‘score’; this table has an entry for every pair of attendees at the meeting but how to give each pair a score? Starting with the premise that a two-person meeting means each person is receiving the full attention of the other I need to find a way to reduce this score as the number of attendees increased and I found the following seemed to be a good fit:
score = minutes / ( n * ( n -1 ) / 2 ) where n = number of attendees
The table below shows the scores for a 60 minute meeting
Attendees, x=(n * (n -1)) / 2, minutes/x
2 1 60
3 3 20
4 6 10
5 10 6
6 15 4
7 21 3
8 28 2
9 36 2
10 45 1
After 10 attendees the score is always set to 1
I found an interesting discussion of Dunbar’s Number in ‘Connected: The Amazing Power of Social Networks’ by Nicholas Christakis which suggests the maximum effective meeting size is 3.8 (OK let’s call it 4) which seems to support the fairly rapid degradation of the importance of a meeting (as a social network building tool) when the number of attendees increases. If you check out the book at Amazon http://www.amazon.co.uk/dp/0007303602/ and look at the preview you’ll see the discussion on page 249.
I’m no Exchange Server expert, maybe there are some better built-in or downloadable
tools for doing what I describe here, but if you’ve loaded emails into a
relational database, as I’ve described previously, the following is extremely
simple. In arranging to get log files from the Exchange server I asked the
administrator if there was anything they wanted to know about that the logs
might reveal and, indeed there were: it turned out they wanted to know who was
sending the most email as storing it all was becoming more and more of a
problem. After trying a few different ways of reporting on the logs we settled
on the following: every time new logs were taken (about every 2 weeks) two
queries are run: the first extracts the top 100 sender-to-recipient traffic by
email count and the second extracts the same but by total message size (which
is why I capture it). Quite often the culprits were system accounts including
one that went a bit mad and sent 300,000 emails in 72 hours! Using these
reports the Exchange administrator has managed to work with development teams
to reduce the number of mails being generated by applications that it seemed no
one was reading.
When working with email there are a few things that can trip you up, here are some tips for avoiding them:
The Exchange server logs contain a message size. I have not yet found any use for this in understanding the social network but it’s useful to have when making friends with the Exchange server administrator, see my next article!
In previous entries about analysis email logs I mentioned the message subject which can, optionally, be included. Now this can be considered sensitive information and how you deal with this will depend on the organisation concerned. The organisation I’ve previously described decided to allow the message subject to be extracted but not stored as-is; instead it was agreed that the message subject would be hashed (a one-way encryption) and then stored. This is useful because it allows conversations to be tracked so that metrics like the average response time can be collected. There are a couple of other useful things to make the best of this approach:
Graph analysis relies on getting data into Nodes (sometimes called Vertices) and Edges. If you have, as I suggested, first built a relational database then a second extract-transform-load step is necessary to get the data into the graph structure. I’ll assume the simplest scenario to describe these steps, which is simply to take all the data. Extract is fairly simple; there are two queries that can be run against the relational database: the first to get the nodes is just a straightforward select against the nodes the second query is to get the edges. The query to get the edges is not so simple and depends how you want to analyse the data; I’ll assume almost the simplest approach: you need to join the email table to the recipients table, select the Sender ID , the Recipient ID and a count(*) this is then grouped by the Sender ID and Recipient ID. This gives an edge for each sender-receiver plus a count of the number of emails; note this is directional, A sends B x emails and B sends A y emails. The simplest possible query could have omitted the count(*) but this is very useful as it gives an indication of the strength of the connection between two nodes (often called the Edge weight). The Transform step could be omitted if the desired analysis can be performed with the nodes and directed edges, however this is not always what’s wanted. If you want to understand the strength of a connection between nodes but don’t care about direction then a transform may be necessary. Now this can be achieved in other ways but it’s useful to understand how to do this in an intermediary because this is useful when combining data from more than one source. Now bear in mind this works for 10,000 nodes: I like to use a hash table (C#) to build the edges. For each edge first re-order the nodes by ID and then create a key by combining the IDs then test the hash table to see if this key exists; if the key is not found create a new entry using the key and store the count as the associated value; if the key already existed retrieve the associated value, add on the count and save it back. The hash table will now contain undirected Edges and the associated combined message count; you can see it would be easy to add in additional counts from other sources to create a combined weight for the relationship. The Load step is going to vary depending on the target but it’s basically taking the nodes as selected from the relational table and the edges from the hash table and getting them into the target. I’ll briefly explore three targets:
I hope this has given an overview of how to get email logs into a graph-aware database or application by using and ETL step to first store an intermediate relational database and a second ETL step to move from a relational to graph structure. Keep an eye out for future postings that I intend to drill into some of the detail and expansion of the architecture described here.
If you want to study an organisation email is a rich source, but what have we learnt about the architecture of a solution that allows this analysis to be conducted? First let me caveat the solution I’ll describe: it was built for an enterprise that manages all of its own email with approximately 2000 users (nodes); now this is part of a larger organisation where we have some interest in connections between the enterprise and larger organisation, for this analysis there are approximately 10,000 nodes; if all emails available are included (including those from outside the larger organisation) then there are approximately 100,000 nodes, we have not performed analysis at this scale. Not all technologies suit all scales of analysis (for example NodeXL is really only effective on graphs with under 2000 nodes) so please bear this in mind for your own domain.
Step 1: Getting hold of the email: our example organisation uses Microsoft Exchange Server which allows the administrator to enable Message Tracking logs; these logs include the sender and recipient list for each email, the date and time is was sent and some other pieces of information. The logs will never include the content of the message but can be configured to include the subject of the message. Depending on your organisations security and/or privacy policies this could be contentious but useful if you can obtain it; I’ll be posting a follow-up entitled “Dealing with Sensitive Data” which describes how the message subject can be used whilst maintaining privacy.
Step 2: Somewhere to put it: ultimately a graph database (like Neo4j), or graph visualisation tools (like Gephi) are going to be the best way to analyse many aspects of the data. However I would recommend first loading the email data into a good old-fashioned relational database (I’ve used SQL Express 2012 for everything I describe here). Reasons for doing this are: (1) familiarity, it’s easy to reason about the data if you have a relational database background; (2) you can perform some very useful analysis directly from the database; (3) it allows you to incrementally load data (I’ve not found this particularly simple in Neo4j); (4) it’s easy to merge with other relational data sources. The structure I’ve discovered works best is as follows:
• “node” table: 1 row per email address consisting of an integer ID (primary key), the email address
• “email” table: 1 row per email with an integer email ID, the ‘node’ ID of the sender, the date and time.
• “recipient” table: an email can be sent to multiple recipients; this table has no unique ID of its own but instead has the “email” ID and the “node” ID of each recipient
The tables are shown below. Note some additional fields that I won’t go into now, the important ones are the first 3 in “email” and the first two in “node” and “recipient”

Step 3: Extract from Email Logs, Transform and Load into the relational database: Firstly you’ll want to open and read each email log-file; the Exchange message tracking logs repeat the information we are concerned with several times as they record he progress of each message at a number of points. I found the best way to get at the data I wanted was to find a line that contained an event-id of “RECEIVE” and source-context is not “Journaling” (you may not have Journaling in your files but probably worth excluding in case it gets enabled one day). The rest is pretty simple: create a “node” record for the sender-address if one does not already exist, create a new “email” record (the sender_ID is the “node” record just created/found) and then for each address in recipient-address create a “recipient” record using the email ID just created and then a new or existing “node” ID for each recipient.
Email logs can add-up to a lot of data so I’d advise loading them incrementally rather than clearing down the database and re-loading every time you get a new batch. This requires you consider how to take account of existing node records: you could do this with a bit of stored procedure logic but my approach was to load all the existing nodes into an in-memory hash-table and keep track that way.
In part 2 I’ll explore how to get the relational representation into a graph.
 Follow