Monthly Archives: July 2013

Chord Diagrams

Circular layouts work well for individual to individual visualisations but for group to
group (such as departments in an organisation) where there is close to a fully
connected graph chord diagrams seem to offer a clearer layout. The following
diagram shows the same data for the volume of communication between
departments. They don’t quite show the same thing: the circular layout’s nodes
are proportional to the size of the department whereas the chord is based
purely on the volume of communication.

circular vs chord

The circular diagram was created with the circular layout plugin in Gephi; the chord diagram is adapted from this article and uses the ds.j3 library which means it’s interactive in the browser.

Running Neo4j on Windows Azure

There are a number of approaches to getting Neo4j onto Azure, some of which are listed on the Neo4j’s website. Dynamic Deploy looked like the best approach but for some reason it would not offer deployment to Europe. There are also some pre-built Linux images but I wanted a Windows-based install so that I could easily troubleshoot any problems. Eventually I followed this post which installs Neo4j into an Azure worker role. This really shows what can be done with the PaaS approach, as opposed to using a VM: it installs and configures Java and Neo4j, creates and/or attaches a virtual hard drive and starts Neo4j bound to a custom port. As the author notes this was written against an older version of the SDK. To bring it to the latest version just search out all the references to Azure libraries and change then to the latest version. I also had problems with the VM as it seems the connection can’t be https; I’ve not investigated why this is so for now I’ve changed it, as shown below, to http:

Neo4j Azure Connection String B

The Storage connection string setting should now look like this:

Neo4j Azure Connection String A

And one more thing, you may find firewalls block port 5000 so you could try some commonly allowed ones like 8080.


Circular Layouts, Binning and Edge Bundling

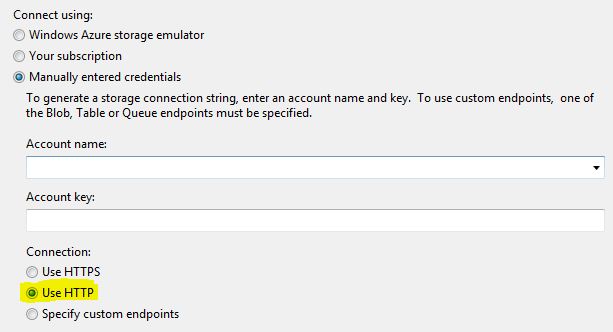
Circular layouts can be very useful and NodeXL does a great job of rapidly exploring social network graphs. However I needed to generate graphs programmatically so turned to the NodeXL libraries. I picked the circular layout but was disappointed with what it produced:

circular plain

Let me explain what this diagram is attempting to show: the rectangular labels are the organisation’s tweeters, the colours represent a sub-division of the organisation they work for. Unlabelled nodes (circles) are the followers. Followers are coloured green or orange based on which information the organisations would like them to receive and this colouring is the same for two specialist sub-divisions. Where an orange line is seen going to a green follower, or vice-versa, then it can be implied that the follower is not receiving the desired information.

This layout is not great: the order of nodes is just as they were added to the graph: all the organisations’ tweeters were added first so cluster together and there is no logic to the order the remaining nodes (followers) are added.

The first improvement that can be made is to use binning. See  http://www.smrfoundation.org/2010/01/14/component-binning-a-network-layout-improvement-in-nodexl-v-108/

To apply Binning with the NodeXL library simply set the UseBinning property:

oCircleLayout.LayoutStyle = LayoutStyle.UseBinning;

The layout now looks like this:

circular binning

We can see now that there is a cluster of followers who follow multiple tweeters from the organisation (clustered towards the top). However it is still quite confusing where a lot of lines cross-over. Maybe curved lines would be better….

oNodeXLVisual.GraphDrawer.EdgeDrawer.CurveStyle = EdgeCurveStyle.Bezier;

circular bezier

Not really an improvement. The answer is Edge Bundling, see these links for better explanations than I can provide:

http://www.cg.tuwien.ac.at/courses/InfoVis/HallOfFame/2007/Alsallakh/

http://www.win.tue.nl/~dholten/papers/bundles_infovis.pdf

http://www.infosthetics.com/archives/2009/06/force_directed_edge_bundling_for_graph_visualization.html

this is how to add it from the NodeXL libraries:

EdgeBundler ebl = new EdgeBundler();

ebl.UseThreading = false; // when running in Azure or it hangs

ebl.BundleAllEdges(oGraph, new Rectangle(0, 0, GraphWidth, GraphHeight));

oNodeXLVisual.GraphDrawer.EdgeDrawer.CurveStyle = EdgeCurveStyle.CurveThroughIntermediatePoints; 
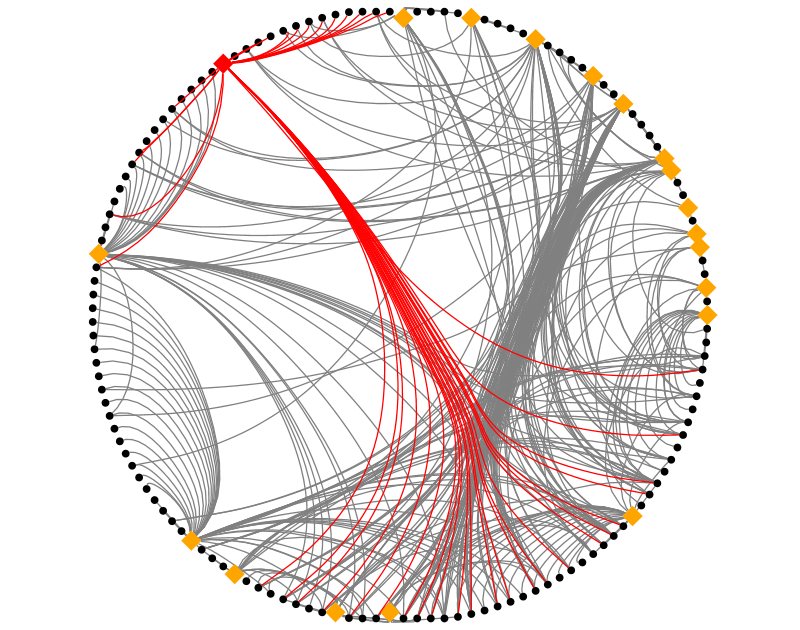
and the result:

circular bundling

which I hope you’ll agree helps reveal some real structure about the tweeters and
their followers.

Update 15/07/2013

I’ve created a test page if you want to try out these features of NodeXL here or get NodeXL

Visualisation for Twitter Followers

An organisation wanting to get its message out through social platforms needs to understand the relationships between the organisations tweeters and their followers. For example how much overlap is there or how many target twitter followers would be totally lost if one of the organisations tweeters was lost. Whilst it’s easy to obtain the basic information about followers and analyse this in tabular format it would be nice if there was a visualisation that convey this information in a more digestible format. Step forward the circular layout:

TweeterEdgeBundleNoLabels

This visualisation was created with NodeXL using the circular layout and bundled edges. The orange diamonds are the organisations’ tweeters and the black circles are followers. One tweeter has been selected and their followers highlighted, in red. The following observations can be made:

  • There are a number of followers who only follow one of the organisations’ tweeters (look at 7 – 12 o’clock)
  • The thickest bundle of connections identifies a number of the organisations’ tweeters with a significant overlap of followers (look at 2 o’clock and  5  – 6 o’clock)
  • The tweeter highlighted in red has a mix of unique and shared followers.

These observations can be used by the organisation to consider how best to get its message to target followers.