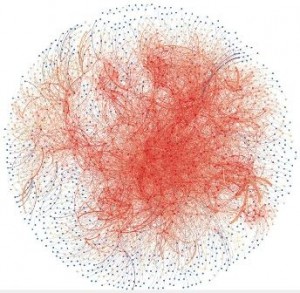
For many organisations their “greatest asset”, and usually largest cost, is the people they employ. It would seem sensible, therefore, for them to want to understand as much as possible about employees and especially if they are deriving the optimum value from them. Traditionally organisations have looked individually at employees, for example through annual reviews. What many organisations do not do is to look at all employees as a whole; this may be because back in the 20th century it was not that easy to find and collate data to allow such analysis. Today organisations have a wealth of data that allow them to look at employees as a whole and, specifically, how they communicate with each other, for example: e-mail, telephone, instant messaging, web browsing, meeting arrangements. The use of some of this information is contentious but a useful starting point is e-mail; by removing the message content and subject we are left with a simple “A sent B a message” and if we record and collate all these interactions over a period and load the information into some analysis software we get to see the following:

Yikes! The above represents the email conversations between 2000 people in an organisation over 24 hours. Dots represent people and the lines between them represent emails. The redder a dot is the more email connections the person it represents has and similarly the redder the line the more emails where sent between those people. The analysis tool (Gephi) has used the Fruchterman Reingold algorithm to arrange the dots (referred to as nodes) into the picture above. As can be observed the better connected nodes have migrated towards the centre but, as can also be observed, it is not even and there are ‘clumps’ of nodes.
The big question is what can an organisation learn and do with this information and is it worth paying for such an analysis? To start with it is relatively easy to visually see the cliques (the ‘clumps’) and also the nodes that connect the cliques (the ‘bridges’). The question of whether having cliques is a good or bad thing will depend on the organisation and who is in which clique. For example the organisation pictured above has, like many, been through a number of mergers, acquisitions, splits and sales and may want to ask “has integration been successful ” – if we see distinct cliques based on the originating company the answer is probably “no”. It may also want to ensure it retains the people who connect the cliques because without them the organisation becomes more disjointed; simply looking at the annual review of these people may not reveal their true value to the organisation. Beyond what can be seen visually there is a large body of research in the field of Social Network Analysis (SNA) where mathematical algorithms can be applied to reveal information about the graph (graph is the technical term for the collection of nodes and their connections).
I am off to Moldova for the next two weeks and have a stack of papers to take with me. When I get back I’ll post what I have learnt and I hope to describe in more detail some Social Network Analysis an organisation could conduct that would provide it with real benefits.
 Follow