Tag Archives: Meetings

Is Instant Messaging being used to pass notes in your meetings?

boredI have observed a couple of behaviours around Instant Messaging (IM) in meetings: the first is IM being used to contact people not in the meeting, either to ask for information pertinent to the meeting, are being asked a question or just to chat about something unrelated because they are bored; the second behaviour is to use IM internally in the meeting where one sub-group will be making comments whilst another is talking. But which of these is more typical and why is this useful to know?

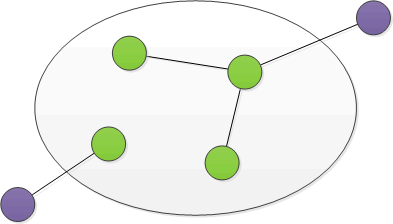
To understand what I’m talking about take a look at this example:

meeting

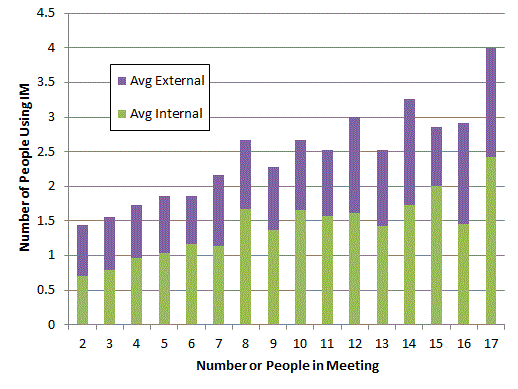
Here we represent four people in a meeting (inside the ellipse) and two people outside the meeting. Lines between the people indicate that they have shared one or more IMs during the meeting. The first chart, below, shows the average number of people involved in IM conversations  for meeting sizes between 2 and 17 people; the sample is about 2000 meetings over 3 months; there are very few meetings with more than 17 people so these are excluded:

IMs in meetings average number of people

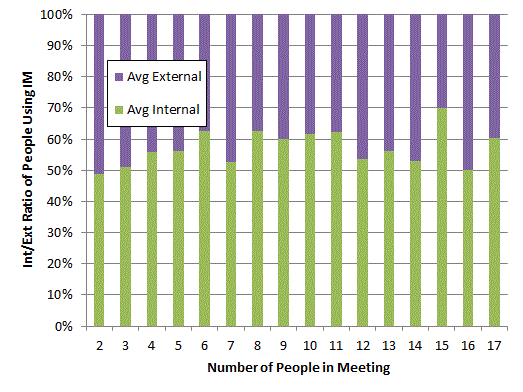
Not unexpectedly as meetings get larger there are a few more people using IM in meetings. The ratio of internal to external IMs looks fairly constant though, but this is best observed with another chart:

IMs in meetings average number of people ratio

The ratio is indeed fairly constant at nearly 50:50.

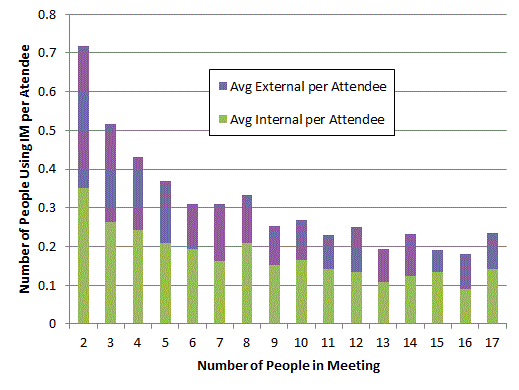
I’ve previously looked for correlations between meeting sizes and number of instant messages (as opposed to the number of people using IM) and not found much. Taking the same approach with the number of people, which is to divide the number of people using IM by the number of people in the meeting we get the following:

IMs in meetings average number of people per attendee

Which, interestingly, shows IMs dropping off on a per-person basis, as the meetings get larger. Is this an indicator of cultural behaviour or is it simply that IM often gets used to tell people the conference call isn’t working / lost the PIN / the phone is broken / can’t use the computer etc.? To answer this would require some analysis of message content, which is possible, but not in the scope of this study. [Complete aside: talking about conference calls check this out]

So why bother? Well most organisations have a bunch of cultural objectives along the lines of “let’s be nice to each other” and, if some further analysis of IMs inside meetings shows that they do not reflect this aspiration, then you can measure your actual culture and observe the trend to see if your cultural change initiatives are working or not.
 

Effectiveness of Large Meetings Revisited


Some time ago I wrote about examining the numbers of Emails sent during meetings and concluded by saying “looking at instant message traffic during meetings would be more revealing” . I now have some IM traffic to compare.

Before continuing I would like to emphasise that all this data is anonymous and I do not believe it should be examined in any other way because humans are more complex than any analysis of this nature can reveal, it is only useful to find biases for a particular behaviour in a particular situation or identify trends.

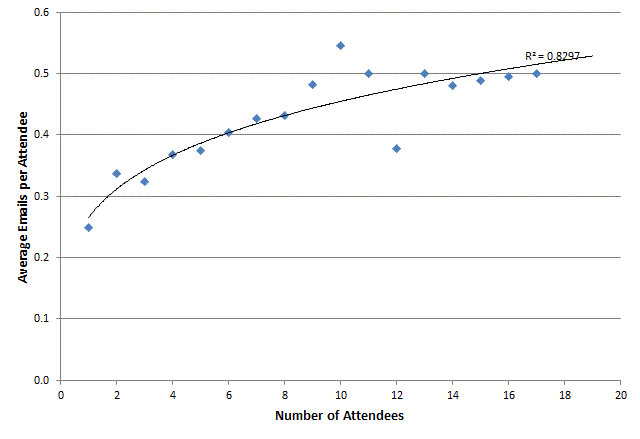
Because I do not have IM data for the same period that my original post relates to I have first re-created the email analysis but restricted it to meetings with all-internal attendees because the IM system is only available employees of the organisation:

emails in meetings 2

This is similar to the previous analysis with the exception of less emails being seen from smaller meetings. This could be due to some major changes in the organisation but I’m not investigating that now.

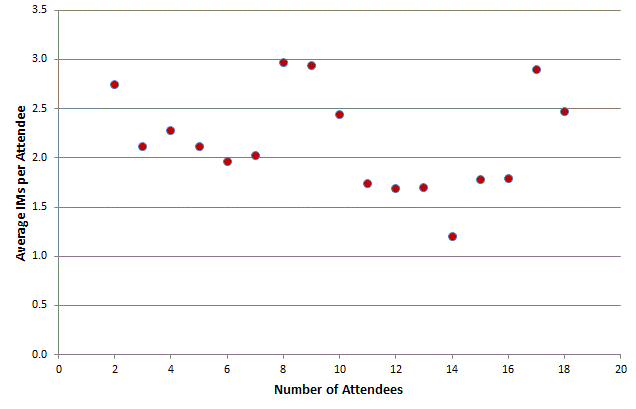
And now the IMs:

IMs in meetings

Well not the result  I expected but this is what the data tells us: no obvious pattern to IM use compared to meeting size. I’m curious if there might be something buried in here, for example is it always the same people using IM in meetings, are they all in the meeting or are they in communication with people not in the meeting; does this ratio change with meeting size?

Combining Data to Weight Social Connections in an Organisation

SNA Data Sources

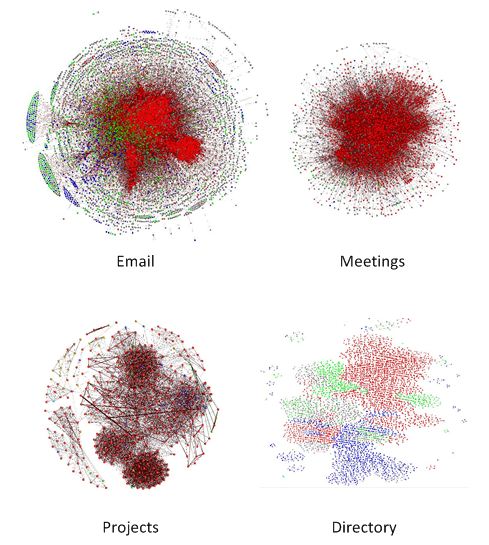
In the above diagram red nodes are from the division of the organisation under study; green and blue are from two other divisions and grey nodes are uncategorised or central functions.

I’ve previously described determining a ‘score’ for social connections taking data from email, meetings, directory and timesheets. The question is how to combine them to produce as complete a picture as possible from the data at hand. I’m fairly sure the best answer is not to simply add the scores together but I’ve not found any guidance that would help do anything except that so that’s exactly what I have done…add them up. To summarise the score (or more correctly weight) given to each edge is made from:

  • 1 point for each email exchanged (where there are a maximum of 10 recipients)
  • 1 point for each minute in a one-to-one meeting, reducing rapidly as the number of attendees in the meeting increases
  • 300 points for being in a manages/managed by relationship
  • 1 point for every hour spent on a project divided by the number of people on the project

I’ve pulled this data together over the following periods:

  • Email: 6 months
  • Meetings: 2 years, 3 months
  • Corporate Directory: 6 months (but this is very slow to change so probably reflects the vast majority of the last 2 years)
  • Projects: 1 year

The coverage of the data also varies:

  • Email: for the core of the organisation being studied this is excellent as the data comes from Exchange Server Logs, for the periphery there is limited coverage as only emails being exchanged with the core are captured
  • Meetings: probably less than 50% as not all rooms are visible and not all meetings are booked in rooms; also teleconference information is not captured
  • Corporate Directory: very good, 90%+ but data is limited to corporate hierarchy
  • Timesheets: good but the system is not used universally as not everyone works on projects.

Some Observations using this approach:

  • Email dominates the structure of the network, the others add very little for those in the core; however for those outside the core the others provide additional insight into the structure.
  • There is overlap in these sources, for example we expect a manger will share emails with their reports and that people on a project will have meetings together but, as the coverage of each source is not compete, this is a small price to pay for seeing the whole network.

Despite the rather simplistic approach the results appear to work quite well but I’d love to hear from anyone who has implemented, or read about, a smarter way to combine these types of SNA sources.

Effectiveness of Large Meetings

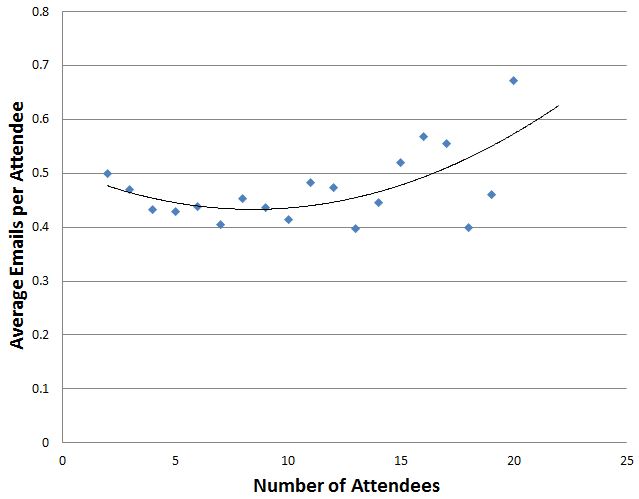
The previous discussion of Dunbar’s number suggests larger meetings will be less effective. Is there any data to support this? The following chart shows emails sent during meetings:

meeting_email

Seems to suggest the larger the meeting the less attention people are paying but not a particularly remarkable result. I expect looking at instant message traffic during meetings would be more revealing.

Beyond Email: Meetings

The next data source you may have in your organisation also comes from Microsoft Exchange Server. If you use Exchange Server to book meeting rooms then this can be mined. As always what can be accessed will depend on your organisations privacy policies. In the organisation I describe here I have access to the calendars for well over half of the meeting rooms using my standard authentication credentials because I am allowed to book meetings in these rooms. Through the room calendar I can also see when other people have booked meetings; it’s not possible to see the meeting subject but it is possible to see a list of attendees. Unlike email I have accessed the meeting room calendars through the Exchange Server API; this is described by a number of others so I won’t reproduce it here, search for ‘Microsoft.Exchange.WebServices’ and ‘GetRoomLists’.

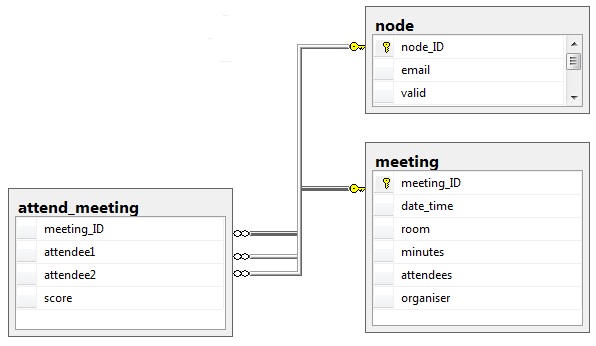
Meetings differ from email in that they are a many-to-many event rather than on-to-many. There will be a meeting organiser but this is often a PA so I do not give any special meaning to them. Just as with email I prefer to load data into a relational database first, the table structure is shown, below.

meetings

You’ll notice that the table attend_meeting has a field ‘score’; this table has an entry for every pair of attendees at the meeting but how to give each pair a score? Starting with the premise that a two-person meeting means each person is receiving the full attention of the other  I need to find a way to reduce this score as the number of attendees increased and I found the following seemed to be a good fit:

score = minutes / ( n * ( n -1 ) / 2 ) where n = number of attendees

The table below shows the scores for a 60 minute meeting

Attendees, x=(n * (n -1)) / 2, minutes/x
2         1                    60
3         3                    20
4         6                    10
5          10                   6
6          15                   4
7          21                   3
8          28                   2
9          36                   2
10         45                   1

After 10 attendees the score is always set to 1

I found an interesting discussion of Dunbar’s Number in ‘Connected: The Amazing Power of Social Networks’ by Nicholas Christakis which suggests the maximum effective meeting size is 3.8 (OK let’s call it 4) which seems to support the fairly rapid degradation of the importance of a meeting  (as a social network building tool) when the number of attendees increases. If you check out the book at Amazon http://www.amazon.co.uk/dp/0007303602/ and look at the preview you’ll see the discussion on page 249.