Tag Archives: Microsoft IIS

IIS Logs Revisited – Time Taken

I showed a colleague my dependency map derived from IIS logs. They thought this was pretty useful but also wanted a way to see responsiveness. IIS logs (when enabled) the time taken for a request to complete, full explanation here. It was very easy to manipulate the previous queries I wrote to count calls to instead return an average time taken. I turned it into some simple graphs on a per-server basis:

IIS time taken graph 1

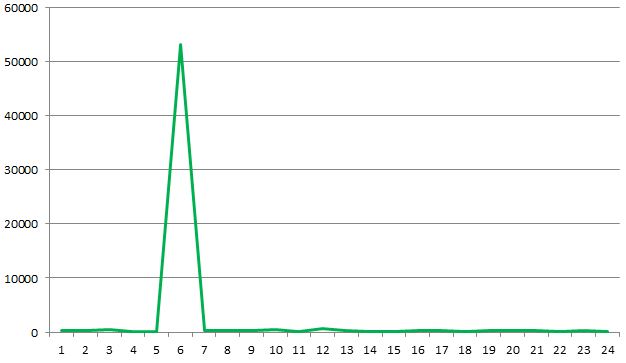
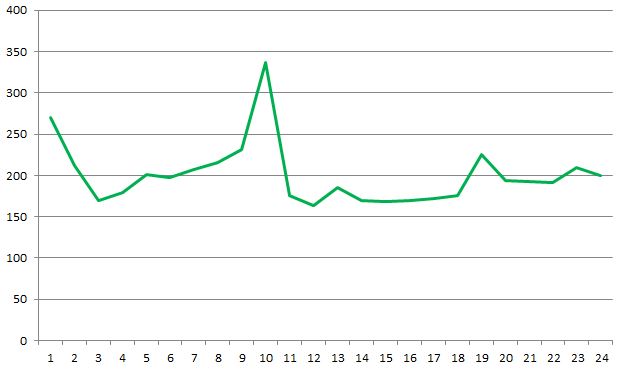
This graph shows the average time taken for each hour on a given server. I wonder where something unusual has happened? Below is the same graph with outliers removed, this is more typical of what was seen across a number of servers:

IIS time taken graph 2

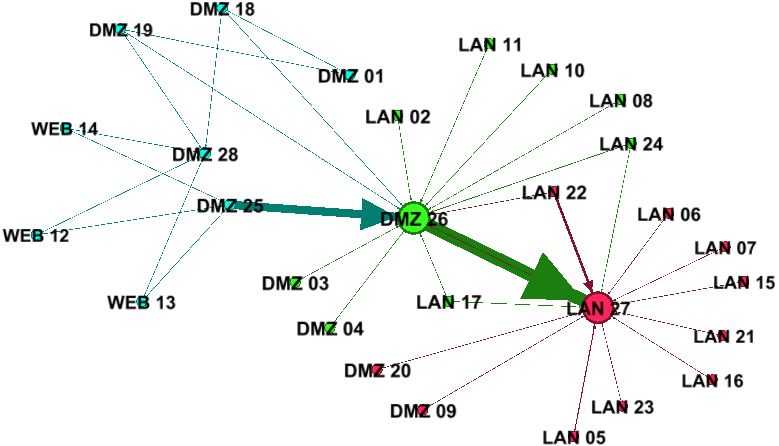
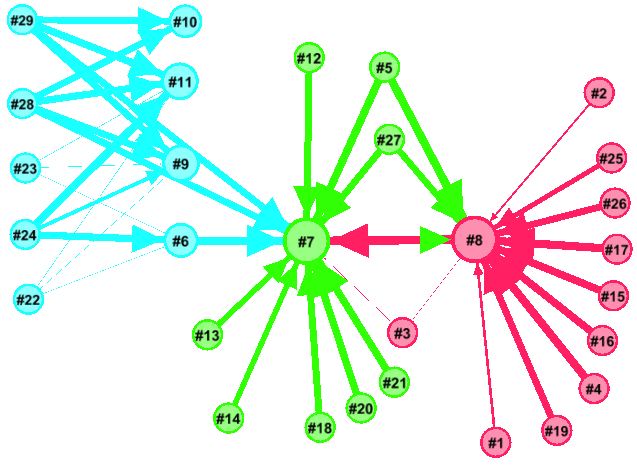
It’s also possible to show a view of all the servers of interest using a graph layout using a tool like Gephi. The weight of each edge represents the average time taken for a call to be serviced, the thicker the line the longer it took. The graph below shows the average time taken for a number of servers over a three week period; the servers to the left are internet-facing and rely on services provided by those to the right:

IIS time taken overview

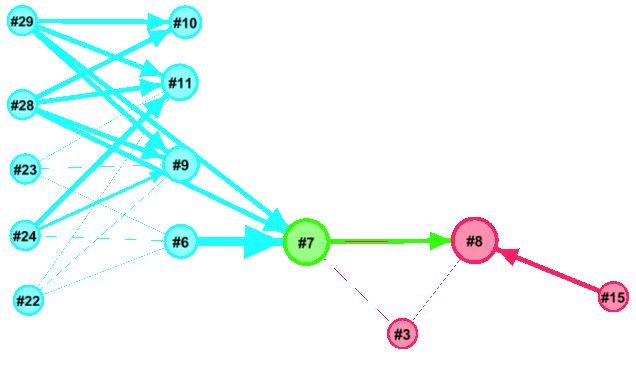
Using Gaphi’s timeline selected times of day can be visualised, below is a quiet period:

IIS time taken quiet

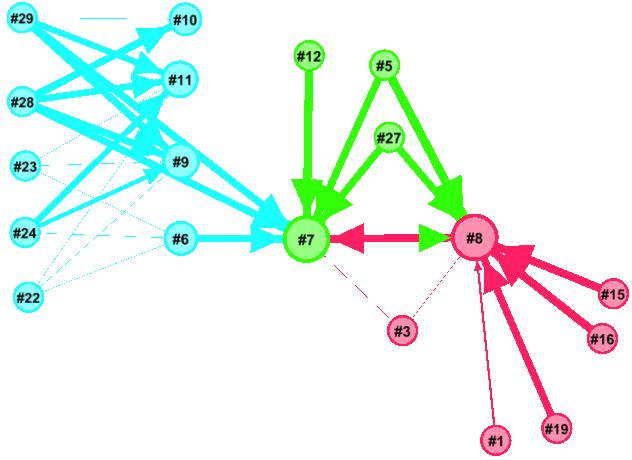
And a busy period; note how #8 is receiving calls from many servers and it’s time taken is increasing which is, in turn, increasing time taken from internet-facing servers.

IIS time taken busy

Check out the animation here (wmv)

This piece of work interestingly coincided with a visit to InfoSec Europe: it was awash with vendors offering log analysis and tools that create a more holistic view of interconnected servers. I only saw some brief demos but I thought LogRhythm looked promising.


Value in IIS Logs

Dependency Discovery

For organisations using Web Services on Microsoft Servers the IIS logs can prove a useful resource. Firstly it’s possible to build a dependency map showing which servers are dependent on services on a given server. Using the Gephi timeline feature it’s also possible to show how the traffic changes over the course of a day, or whatever period. The Gephi graph below shows data collected from a number of servers over an 18 day period. The edges have been weighted with a logarithm of the number of calls received per minute. The colours represent clusters detected by Gephi and not derived from any information about the server. Now you might think an IT department will know all the dependencies between servers; well maybe it should but this exercise did reveal a few surprises and even if it did not it is still a worthwhile exercise to validate dependency information.

IISdependencies

Deviance Detection

Log files can be used to automatically create a baseline of ‘normal’ behaviour. This can then be compared with current behaviour and anomalies identified. A simplistic approach is to calculate an average of calls to a web server historically and then compare with the number of current calls. The chart, below, shows this for one server: the blue line is the average number of calls per minute of the day from days 1 to  17; the red line is the number of calls received each minute on day 18

IISperformance

Social Network Detection

All very interesting but can IIS logs help build a picture of Social Networks? Well I’m not sure as I’ve not tried but it lets you see who used what and when, well certainly for internal apps. People who use the same app around the same time or with similar usage patterns are probably doing a similar job so may know each other and, if they don’t, maybe they should.