Category Archives: Social Network Analysis

Departmental Factions

communities

A colleague said to me today ‘oh that department has a number of factions’. Hmmm, did the data reflect this….I loaded data for just that department into Gephi (the data combined email, meetings, projects and hierarchy to deduce the social network). I ran Modularity and sure enough four partitions popped out. My colleague took a look at the names in each partition and said ‘yeah, looks about right’.

Here is the Graph coloured by the community detected (anonymised).

Enhancing Email with Directory Information

If you want to perform analysis comparing sub-sets of a graph derived from your email logs you will need to bring in some additional data, for example department. You might be lucky in that the organisations addressing scheme provides some clues e.g. ‘[email protected]’ or ‘[email protected]’  but if not you will have to find another source. Now you might have an efficient HR department who could provide an extract of employees with department, role and any other data they don’t mind you having. Or they might not be so helpful. If HR won’t help there are some other sources: the directory service (e.g. Microsoft Active Directory) or maybe an intranet site that acts as a phonebook and/or organisational chart. Which one you select will depend on content and accuracy. In my case the intranet site provided both the most accurate and richest source of data. Each intranet is going to be different so maybe the following is not going to work for yours but I hope the approach provides some inspiration.

The intranet I have worked with is composed of two page types:

  1. A page describing the employee with phone numbers, job role, location, department and also some free-text fields allowing people to input experience, skills, what they work on and languages spoken.
  2. A Hierarchy page: given an employee it displays their manager and direct reports.

Luckily each page type could be bought up by knowing the employee and manager ID and constructing a fairly simple url.

I thought it would be useful to understand where an employee sits in the overall structure so I wrote a program to traverse the directory top-down. Given a known starting point (the ID of the most senior employee and their manager, effectively blank) the algorithm worked like this:

  1. Find all the direct reports of the current employee
  2. Recursively call step 1 for each direct report (if any) and keep a count of how many there are
  3. Get the directory information for the current employee
  4. Store the directory information and the count of direct reports plus any other derived information (e.g. the employee’s level in the hierarchy and a list of all the managers above them)

Now unfortunately this does not find all the employees we have email records for; this turned out to be because the intranet directory is incomplete so as a second exercise:

  1. Find all the employees for which there is an email record but no directory entry recorded from the first phase
  2. Query the intranet directory by email address (fortunately this was a feature of the one I was using)
  3. Store the directory information

This second step could be used to populate the whole list but it does not provide such rich hierarchical information.

The directory information is best retained in its own table. This is because it changes over time and should be obtained periodically (e.g. monthly). However a refresh of the directory data SHOULD NOT overwrite, instead add a field that contains the date the data was fetched. This makes it possible to use directory data that corresponds to the period of data being analysed or to still derive a tie between people: if A used to manage B, even if they no longer do.

Example directory table. Note: RunDate is the date the directory was traversed (there will be multiple runs in 1 table);  ID and manager are internal IDs for the intranet directory; rank is the position in the hierarchy (0 highest); Span is the number of direct reports.

directory

Dealing with Sensitive Data (e.g. email Message Subject)

In previous entries about analysis email logs I mentioned the message subject which can, optionally, be included. Now this can be considered sensitive information and how you deal with this will depend on the organisation concerned. The organisation I’ve previously described decided to allow the message subject to be extracted but not stored as-is; instead it was agreed that the message subject would be hashed (a one-way encryption) and then stored. This is useful because it allows conversations to be tracked so that metrics like the average response time can be collected. There are a couple of other useful things to make the best of this approach:

  1. Before doing anything with the message subject turn the whole string into consistent case (upper or lower, your choice) otherwise “Hello” and “hello” give different hash values.
  2. Strip of the subject prefix (“RE:”, “FW:”) and do this repeatedly until none are left. Store the outermost prefix as-is (no hashing) and then hash and store the remainder of the message subject. In Social (Organisational) Network Analysis using email – Practical Architecture Part 1 the email table contains the fields ‘subject_prefix’ and ‘subject_hash’ – this is what these fields store.
  3. Base64 encode the hashed value otherwise you’ll run into trouble with escape characters.

Social (Organisational) Network Analysis using email – Practical Architecture Part 2

Graph analysis relies on getting data into Nodes (sometimes called Vertices) and Edges. If you have, as I suggested, first built a relational database then a second extract-transform-load step is necessary to get the data into the graph structure. I’ll assume the simplest scenario to describe these steps, which is simply to take all the data. Extract is fairly simple; there are two queries that can be run against the relational database: the first to get the nodes is just a straightforward select against the nodes the second query is to get the edges. The query to get the edges is not so simple and depends how you want to analyse the data; I’ll assume almost the simplest approach: you need to join the email table to the recipients table, select the Sender ID , the Recipient ID and a count(*) this is then grouped by the Sender ID and Recipient ID. This gives an edge for each sender-receiver plus a count of the number of emails; note this is directional, A sends B x emails and B sends A y emails. The simplest possible query could have omitted the count(*) but this is very useful as it gives an indication of the strength of the connection between two nodes (often called the Edge weight). The Transform step could be omitted if the desired analysis can be performed  with the nodes and directed edges, however this is not always what’s wanted. If you want to understand the strength of a connection between nodes but don’t care about direction then a transform may be necessary. Now this can be achieved in other ways but it’s useful to understand how to do this in an intermediary because this is useful when combining data from more than one source. Now bear in mind this works for 10,000 nodes: I like to use a hash table (C#) to build the edges. For each edge first re-order the nodes by ID and then create a key by combining the IDs then test the hash table to see if this key exists; if the key is not found create a new entry using the key and store the count as the associated value; if the key already existed retrieve the associated value, add on the count and save it back. The hash table will now contain undirected Edges and the associated combined message count; you can see it would be easy to add in additional counts from other sources to create a combined weight for the relationship. The Load step is going to vary depending on the target but it’s basically taking the nodes as selected from the relational table and the edges from the hash table and getting them into the target. I’ll briefly explore three targets:

  • Node XL (remember good for small sets of data, < 1000): if you are using .NET then it’s very simple to drop the NodeXL control onto a Windows form and get a reference to the underlying object model. Then whip through the nodes (or vertices as NodeXL calls them) and add them followed by the Edges; for each Edge you need to get the Node IDs which just requires a quick lookup directly from the NodeXL model.
  • Gephi (can handle larger sets, easily 10,000 nodes): my favourite approach is to write out a .GEXF file following very much the method above but there is no need to look-up any internal references for the Edges, you just need the two Node IDs.
  • Neo4j (can handle larger sets, easily 10,000 nodes): if you are writing in Java then I believe it’s possible to directly manipulate the object model (very much like you can with .NET and NodeXL) but I used the REST API which is definitely fast enough when running on the same computer. There are some .NET libraries available the wrap the REST API but the level of maturity varies. I have found a problem specific to Neo4j, which is it wants to create its own node IDs which can’t be changed. When you create a new Node Neo4j returns the ID which you will need when adding the Edges, so I suggest recording these in a hash-table to map them to the Node ID from the relational database otherwise you will need to query Neo4j to get the IDs every time you add an Edge.

I hope this has given an overview of how to get email logs into a graph-aware database or application by using and ETL step to first store an intermediate relational database and a second ETL step to move from a relational to graph structure. Keep an eye out for future postings that I intend to drill into some of the detail and expansion of the architecture described here.

Social (Organisational) Network Analysis using email – Practical Architecture Part 1

If you want to study an organisation email is a rich source, but what have we learnt about the architecture of a solution that allows this analysis to be conducted? First let me caveat the solution I’ll describe: it was built for an enterprise that manages all of its own email with approximately 2000 users (nodes); now this is part of a larger organisation where we have some interest in connections between the enterprise and larger organisation, for this analysis there are approximately 10,000 nodes; if all emails available are included (including those from outside the larger organisation) then there are approximately 100,000 nodes, we have not performed analysis at this scale. Not all technologies suit all scales of analysis (for example NodeXL is really only effective on graphs with under 2000 nodes) so please bear this in mind for your own domain.
Step 1: Getting hold of the email: our example organisation uses Microsoft Exchange Server which allows the administrator to enable Message Tracking logs; these logs include the sender and recipient list for each email, the date and time is was sent and some other pieces of information. The logs will never include the content of the message but can be configured to include the subject of the message. Depending on your organisations security and/or privacy policies this could be contentious but useful if you can obtain it; I’ll be posting a follow-up entitled “Dealing with Sensitive Data” which describes how the message subject can be used whilst maintaining privacy.
Step 2: Somewhere to put it: ultimately a graph database (like Neo4j), or graph visualisation tools (like Gephi) are going to be the best way to analyse many aspects of the data. However I would recommend first loading the email data into a good old-fashioned relational database (I’ve used SQL Express 2012 for everything I describe here). Reasons for doing this are: (1) familiarity, it’s easy to reason about the data if you have a relational database background; (2) you can perform some very useful analysis directly from the database; (3) it allows you to incrementally load data (I’ve not found this particularly simple in Neo4j); (4) it’s easy to merge with other relational data sources. The structure I’ve discovered works best is as follows:
• “node” table: 1 row per email address consisting of an integer ID (primary key), the email address
• “email” table: 1 row per email with an integer email ID, the ‘node’ ID of the sender, the date and time.
• “recipient” table: an email can be sent to multiple recipients; this table has no unique ID of its own but instead has the “email” ID and the “node” ID of each recipient
The tables are shown below. Note some additional fields that I won’t go into now, the important ones are the first 3 in “email” and the first two in “node” and “recipient”

Basic table structure for email

Step 3: Extract from Email Logs, Transform and Load into the relational database: Firstly you’ll want to open and read each email log-file; the Exchange message tracking logs repeat the information we are concerned with several times as they record he progress of each message at a number of points. I found the best way to get at the data I wanted was to find a line that contained an event-id of “RECEIVE” and source-context is not “Journaling” (you may not have Journaling in your files but probably worth excluding in case it gets enabled one day). The rest is pretty simple: create a “node” record for the sender-address if one does not already exist, create a new “email” record (the sender_ID is the “node” record just created/found) and then for each address in recipient-address create a “recipient” record using the email ID just created and then a new or existing “node” ID for each recipient.

Email logs can add-up to a lot of data so I’d advise loading them incrementally rather than clearing down the database and re-loading every time you get a new batch. This requires you consider how to take account of existing node records: you could do this with a bit of stored procedure logic but my approach was to load all the existing nodes into an in-memory hash-table and keep track that way.

In part 2 I’ll explore how to get the relational representation into a graph.

Academic Papers on Social Networking Analysis

Whist I was away in Moldova I looked through some academic papers on SNA. There are many papers on the subject so I just looked at the ones which seemed to be most relevant: those that discussed SNA using email data. One paper included analysis of the text of the email as well as the less sensitive information such as sender and recipient so this was not directly applicable to email log analysis. Others, however, had recognised that an organisation is unlikely to allow analysis of email contents and concentrated on what could be learnt from other information in the log (excluding message subject). Here is a summary of what these papers demonstrated could be learnt:

  • The real organisation structure (as opposed to what’s on organisational charts)
  • Various ranking of individuals
  • Identification of vulnerabilities
  • Rate of adaptability to change
  • Assessing morale

There was also some interesting insight into how to squeeze as much information from email logs as possible. For example I had not really considered the time an email was sent as a particularly useful piece of data but it can be when looking at how quickly an email is sent back by a recipient (i.e. A send B and email, 5 minutes later B sends A and email); the faster the response from, B to A, the more likely A is more important.

Unfortunately what the academic papers do not do is put value on what any of this information and analysis is worth; I expect this will only come from experience or looking at the experience of others, as we learn more I will post more.

Analysing Email – What Can An Organisation Learn About Itself?

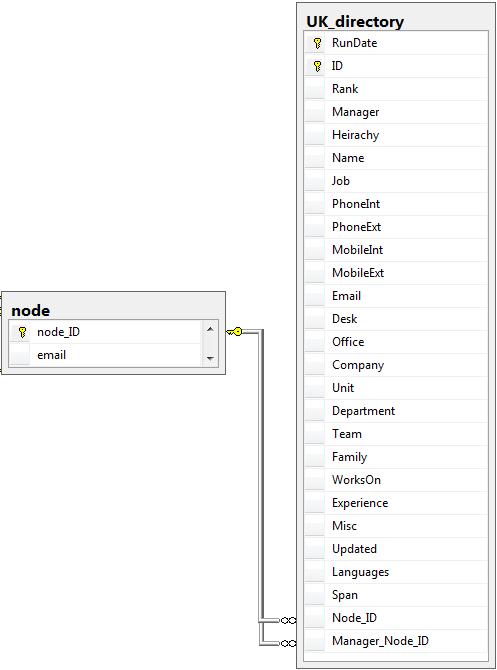
For many organisations their “greatest asset”, and usually largest cost, is the people they employ. It would seem sensible, therefore, for them to want to understand as much as possible about employees and especially if they are deriving the optimum value from them. Traditionally organisations have looked individually at employees, for example through annual reviews. What many organisations do not do is to look at all employees as a whole; this may be because back in the 20th century it was not that easy to find and collate data to allow such analysis. Today organisations have a wealth of data that allow them to look at employees as a whole and, specifically, how they communicate with each other, for example: e-mail, telephone, instant messaging, web browsing, meeting arrangements. The use of some of this information is contentious but a useful starting point is e-mail; by removing the message content and subject we are left with a simple “A sent B a message” and if we record and collate all these interactions over a period and load the information into some analysis software we get to see the following:

emailmap

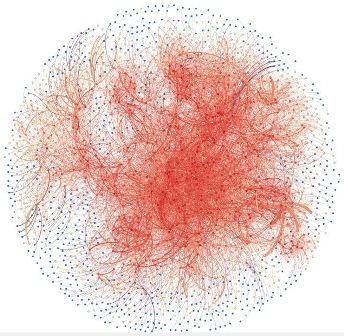
Yikes! The above represents the email conversations between 2000 people in an organisation over 24 hours. Dots represent people and the lines between them represent emails. The redder a dot is the more email connections the person it represents has and similarly the redder the line the more emails where sent between those people. The analysis tool (Gephi) has used the Fruchterman Reingold algorithm to arrange the dots (referred to as nodes) into the picture above. As can be observed the better connected nodes have migrated towards the centre but, as can also be observed, it is not even and there are ‘clumps’ of nodes.

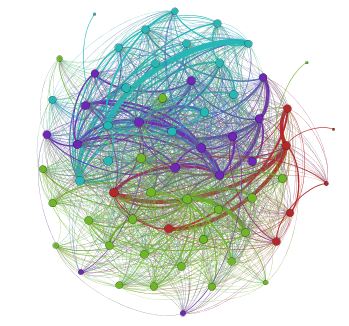
The big question is what can an organisation learn and do with this information and is it worth paying for such an analysis? To start with it is relatively easy to visually see the cliques (the ‘clumps’) and also the nodes that connect the cliques (the ‘bridges’). The question of whether having cliques is a good or bad thing will depend on the organisation and who is in which clique. For example the organisation pictured above has, like many, been through a number of mergers, acquisitions, splits and sales and may want to ask “has integration been successful ” – if we see distinct cliques based on the originating company the answer is probably “no”. It may also want to ensure it retains the people who connect the cliques because without them the organisation becomes more disjointed; simply looking at the annual review of these people may not reveal their true value to the organisation. Beyond what can be seen visually there is a large body of research in the field of Social Network Analysis (SNA) where mathematical algorithms can be applied to reveal information about the graph (graph is the technical term for the collection of nodes and their connections).

I am off to Moldova for the next two weeks and have a stack of papers to take with me.  When I get back I’ll post what I have learnt and I hope to describe in more detail some Social Network Analysis an organisation could conduct that would provide it with real benefits.