If influence can roughly be equated with the volume, and to whom, an individual communicates then an ‘influencing score’ can be calculated. I’m not looking here at measures of centrality; although I do plan in incorporate this at a later date. Within what appears to be a command-and control organisation rank is very important and is known for each individual. I propose that the influencing score between any two individuals is made from the following three factors:
- The rank of the target to which the subject is connected
- The strength of the connection (dictated by the lowest scoring edge)
- The distance (number of edges) from the subject to the target
It would also be essential to track changes over time is this to be a useful measure.
How did I go about creating this?
- First I created a scored relationship, as described before, (but reducing the value of being a line manager to 30) between each person (node) on a per-month basis. Each relationship (link) was typed consistently so, for example for May 2013 is called MONTH_2013_05
- Secondly I use a dynamically generated Cypher query to obtain the graph (network) of relationships to the subject for each month: START n=node:node_auto_index(email = ‘[email protected]’) MATCH p = (n)-[:MONTH_2013_05*1..2]-(x) RETURN DISTINCT ‘~’ AS begin, length(p) AS len, EXTRACT( n IN NODES(p):n.email + ‘<‘ + n.rank + ‘>’) AS email, EXTRACT( r IN RELATIONSHIPS(p):r.score) AS score. I won’t pick this query apart here but if anyone wants an explanation please get in touch. I’m also not using any Neo4j client libraries and simply parsing out the result which is why there is a ‘~‘ to mark the start of each record.
- The score, for each path (the ‘p’ in the Cypher query is then calculated and all the scores are added together. Here is an example: A—(67)—B—(50)—C<rank 4> where A is the subject has a score of 50 (the weakest link) * 6 ( the multiplier for rank 4, more later) * 0.1 (the distance factor)
Because rank is considered so important the highest ranks are given much higher multipliers as listed: 0:100, 1:50, 2:25, 3:12, 4:6, 5:3, 6:2, <=7:1
Indirect relationships are reduced to 10% of the score for a direct relationship. The Cypher query only returns a maximum of 1 intermediate node (1..2)
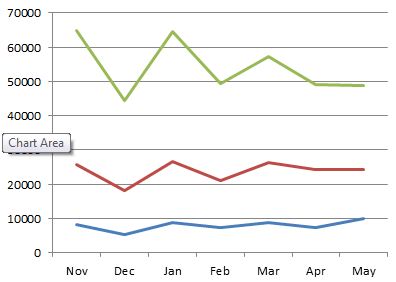
The following chart shows a plot for three individuals who are in a direct line of management; as expected the influencing score drops as the rank drops. The relative scores are also reasonably consistent.
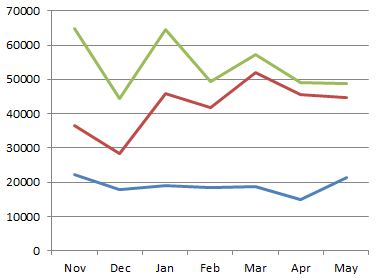
The next plot shows another direct line management relationship, the senior manager is the same as before. This time it shows a distinct rise in influence of the mid-ranked individual.
The measurement of influence I have described is fairly crude, for example it bounces around based on when people are on holiday (this can be fixed by using a value averaged over active days) and there is a degree of double-counting (which can be removed by pruning indirect connections when a direct connection exists) however empirically it produces results that reflect reality of individuals known to the author.


 Follow
Pingback: Your Data and NOSQL: Graph Databases | Gimeno IT Europe Ltd.
Pingback: Options for Structuring Graph Databases | Robert Gimeno's Adventures in Data Science
Pingback: Organisational Network Analysis: Actionable Insight during Restructuring | Robert Gimeno's Adventures in Data Science